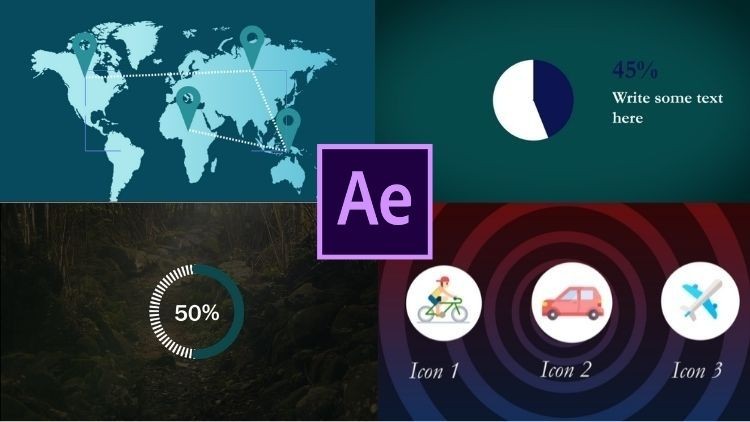
Adobe After Effects: Infographics & data visualization
Learn how to use Adobe after effects To Create infographics & data visualization
4.11 (46 reviews)

12,539
students
2 hours
content
Jun 2020
last update
$19.99
regular price
What you will learn
Create Animated infographics: line Graphs, Bar Charts and Pie Charts in after effects
Use special effects and presets to create graphs in after effects
Understand and Use expressions to help create charts in after effects
Apply pro techniques to change graph values in after effects
Related Topics
3112480
udemy ID
5/10/2020
course created date
6/23/2020
course indexed date
Lee Jia Cheng
course submited by