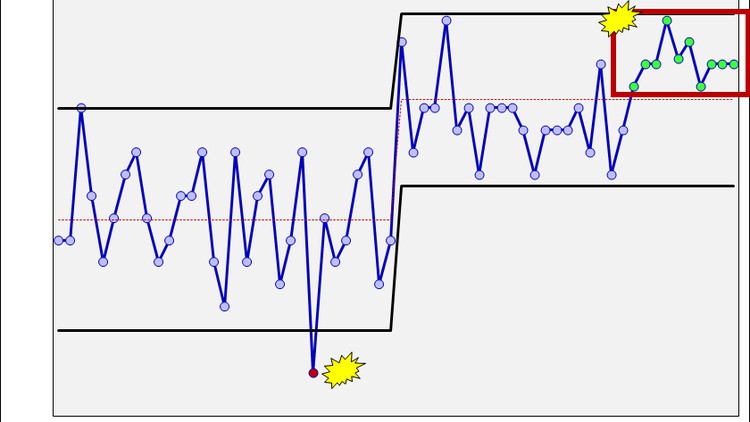
Quality Management in Excel- Control Charts
Using and Applying Control Charts in Industry
4.71 (28 reviews)

176
students
4 hours
content
May 2024
last update
$64.99
regular price
What you will learn
Statistical Process Control
how to use and interpret Control Charts
how to understand Process Variation
Six Sigma concepts and tools
Process Improvement concepts and tools
Continuous Improvement concepts and tools
how to perform statistical Data Analysis
Statistics
Data Visualizations
Quality Management
Process Quality
Quality
Screenshots


Related Topics
4337118
udemy ID
10/6/2021
course created date
2/1/2022
course indexed date
Bot
course submited by