Creating Heatmaps and Clustering in R
A practical course in analyzing data used for heatmaps and finding and visualizing clusters in your data
4.33 (15 reviews)
118
students
2 hours
content
Jul 2020
last update
$44.99
regular price
What you will learn
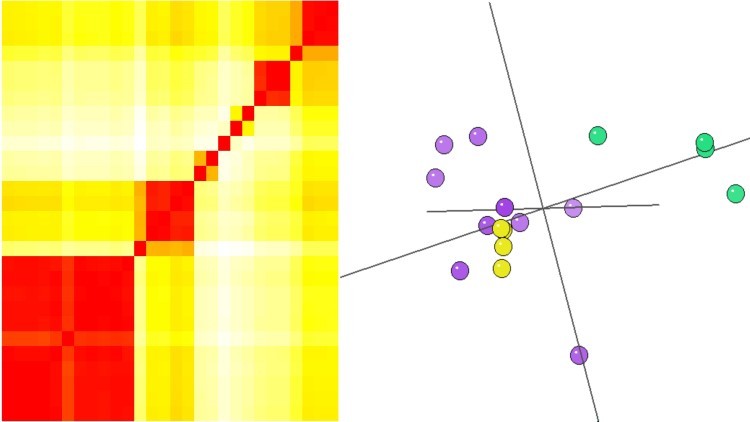
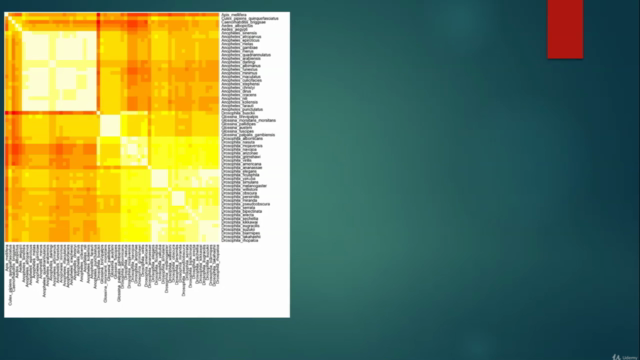
to create colorful heatmaps showing the relationship between species
and also gene expression levels between samples
how to cluster species/genes in the data sets
Screenshots
Related Topics
3245120
udemy ID
6/17/2020
course created date
5/7/2022
course indexed date
Bot
course submited by