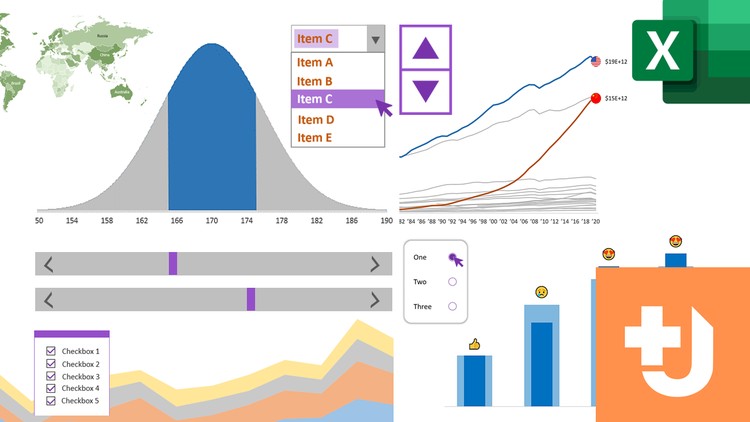
Data Visualization: How to Create Dynamic Excel Charts
Learn how to create interactive/dynamic excel charts step-by-step with comprehensive guide.
4.63 (4 reviews)

313
students
1.5 hours
content
Feb 2025
last update
$19.99
regular price
What you will learn
Use Form Controls & Pivot Table (dropdown list, radio button, spin button, checkbox, scroll bar, slicer, etc.) to create interactive charts & graphs.
Use advanced Excel formulas and functions to generate custom data visualization.
Format and customize charts to make meaningful and impactful visuals.
Build stunning, professional-looking data presentation with Excel demo-exercises.
Understand how to interpret and present data using a variety of chart types.
Explore how to use data visualizations to make decisions.
Screenshots


Related Topics
5167494
udemy ID
2/19/2023
course created date
2/22/2023
course indexed date
Bot
course submited by