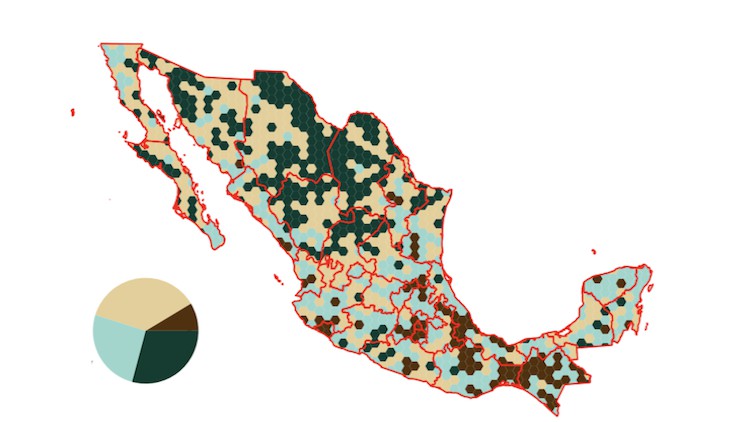
Geospatial Data Science with Python: Data Visualization
Tabular and Geospatial visualizations with Matplotlib, Pandas, Seaborn, Plotly, Bokeh, and more!
4.47 (71 reviews)

1,028
students
8 hours
content
Apr 2021
last update
$59.99
regular price
What you will learn
How to visualize both tabular and geospatial data with matplotlib, pandas, geopandas, seaborn, plotly, folium, and more.
Screenshots


Related Topics
3886184
udemy ID
3/2/2021
course created date
3/31/2021
course indexed date
Bot
course submited by