LGTM Stack for Monitoring using Loki, Grafana, Tempo & Mimir
Grafana Labs’ observability: Loki - logs, Grafana - dashboards and visualization, Tempo - traces, Mimir - metrics
4.58 (12 reviews)

2,163
students
9 hours
content
Nov 2024
last update
$44.99
regular price
What you will learn
Understand the architecture and components of the Grafana LGTM stack for effective monitoring and observability.
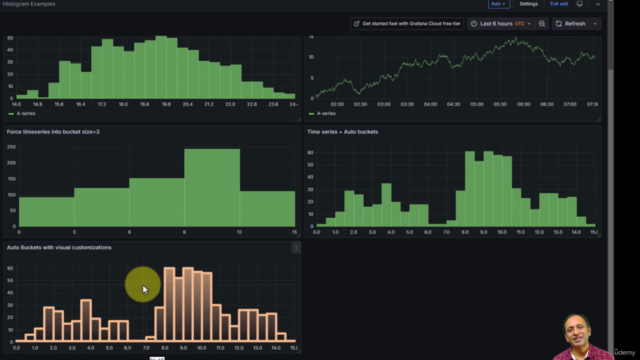
Build and customize Grafana dashboards to visualize metrics, logs, and traces with precision.
Configure and integrate Prometheus, Loki, and Tempo data sources for seamless data ingestion and analysis.
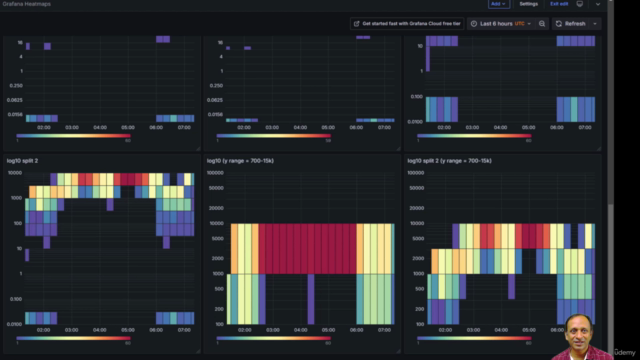
Master advanced panel and visualization options to create interactive and insightful dashboards.
Apply transformations and queries to refine, group, and analyze data efficiently within Grafana.
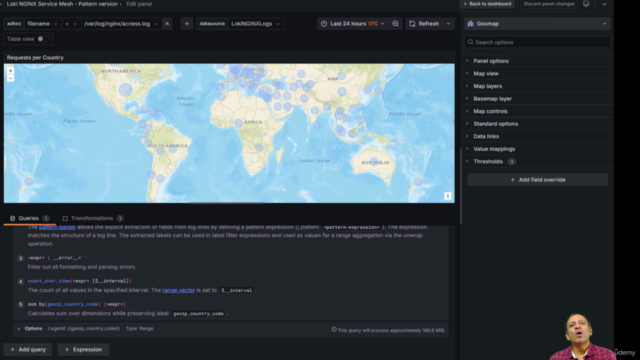
Leverage Loki for log aggregation and Tempo for distributed tracing to troubleshoot system performance.
Explore Mimir for long-term storage of Prometheus metrics and optimize storage and retrieval.
Gain hands-on experience with real-world scenarios, from setting up data sources to implementing observability solutions.
Screenshots


6052247
udemy ID
7/1/2024
course created date
11/16/2024
course indexed date
Bot
course submited by