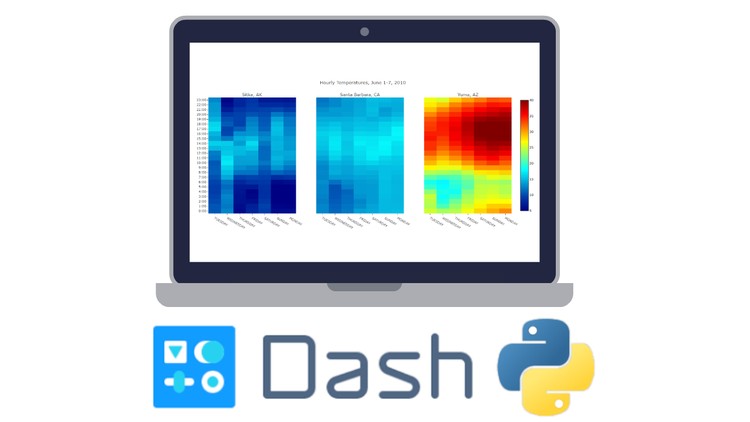
Interactive Python Dashboards with Plotly and Dash
Learn how to create interactive plots and intelligent dashboards with Plotly, Python, and the Dash library!
4.56 (8998 reviews)

50,193
students
9.5 hours
content
Sep 2019
last update
$124.99
regular price
What you will learn
Learn about Plotly to create plots like Bar Charts, Line Charts, Scatter Plots, Heat Maps, and more!
Create Layouts with Plotly's Dash library.
Use Dash to create interactive components with Plotly.
Learn how to connect multiple inputs and outputs with a dashboard.
Update live interactive graphs with clicks, hover overs, and more.
Connect the interactive dashboard to live updating data for streaming information.
Learn how to secure your interactive dashboards with App Authorization.
Deploy your interactive dashboards to the internet with services like Heroku.
Screenshots


Related Topics
1575562
udemy ID
3/1/2018
course created date
8/14/2019
course indexed date
Bot
course submited by