Data Analysis And Business Intelligence With Microsoft Excel
Use Power Query, Power Pivot, DAX, & Excel's data visualization tools to build powerful Business Intelligence solutions
4.47 (462 reviews)

33,283
students
9 hours
content
Feb 2025
last update
$69.99
regular price
What you will learn
Use Power Query to pull external datasets into Excel, and transform them into whatever shape is needed for your analysis
Master the art and science of Data Modeling in Excel, connecting your datasets from Power Query so they can be analyzed together
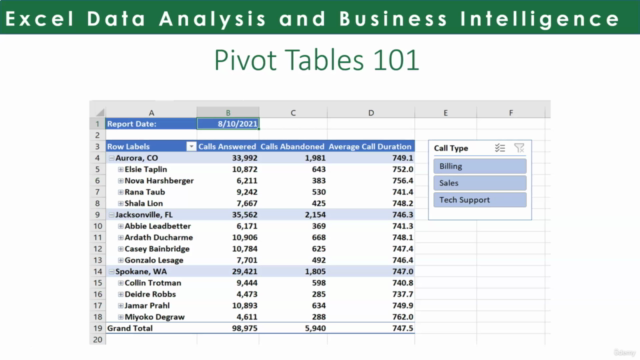
Build "Power" Pivot Tables to rapidly extract insights from your Data Model, whether your data tables have 10 rows or 10 million
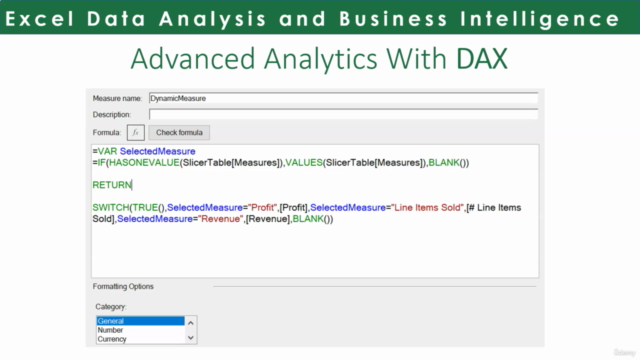
Become proficient in the DAX formula language, to inject more sophisticated calculations and KPIs into your Pivot Tables than you even thought possible
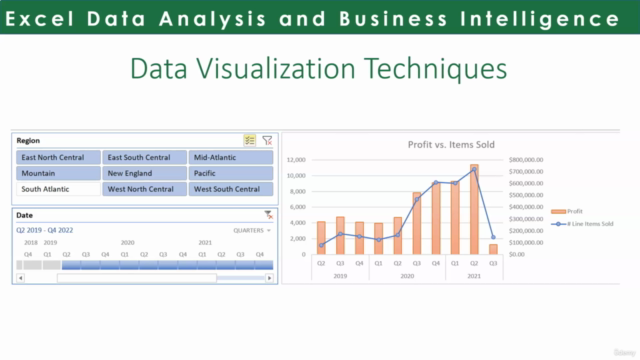
Polish your calculations into professional presentations with data visualization tools like Pivot Charts and conditional formatting
Leverage Slicers and Timelines to engineer dynamic dashboards that maximize the amount of information you can present on a single screen
Retain - AND build on - everything you've learned, by tackling dozens of hands-on exercises that cover every concept in the course
Screenshots
Related Topics
4269692
udemy ID
8/29/2021
course created date
10/22/2021
course indexed date
Angelcrc Seven
course submited by