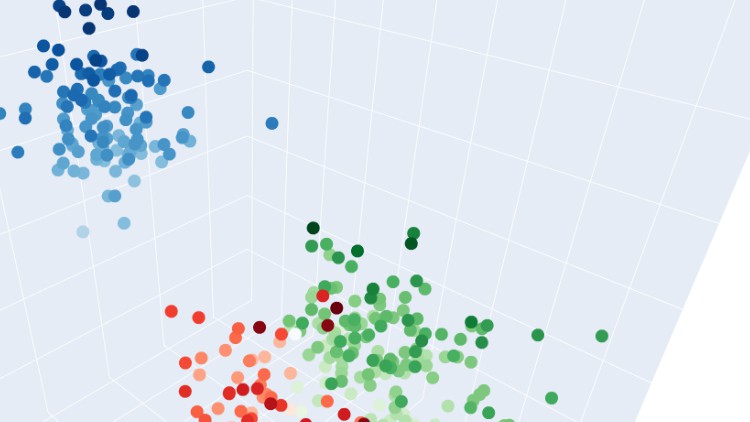
Principles of Beautiful Data Visualization (2022)
Fundamental Principles, Cool Graphs & Charts in Python
4.70 (91 reviews)

1,357
students
2.5 hours
content
Jan 2022
last update
$44.99
regular price
What you will learn
Understand the core concepts of Data Visualization
Level-up Data Viz skills regardless of the programming language or visualization tool you use
What makes Data Visualization "Beautiful"?
Visualizing quantity of variables, their distributions and relationships
Appropriate charts and plots to use for appropriate data
Choosing colors, scales, fonts and symbols for elegant Data Visualization
Advanced Data Visualization with Python using Plotly, Seaborn and Matplotlib
Screenshots


Related Topics
4056390
udemy ID
5/17/2021
course created date
6/17/2021
course indexed date
Bot
course submited by