Data Analytics with Excel: For SaaS & Software Companies
Analyze Data, Create Charts and Build Effective Presentation Slides: A Step-by-Step Guide
4.72 (54 reviews)
414
students
3 hours
content
Feb 2023
last update
$69.99
regular price
What you will learn
Excel for data analysis
Manipulate raw data
Analyze financial and operational data
Advanced IF formulae (multiple IFs, SUMIFs, COUNTIFs)
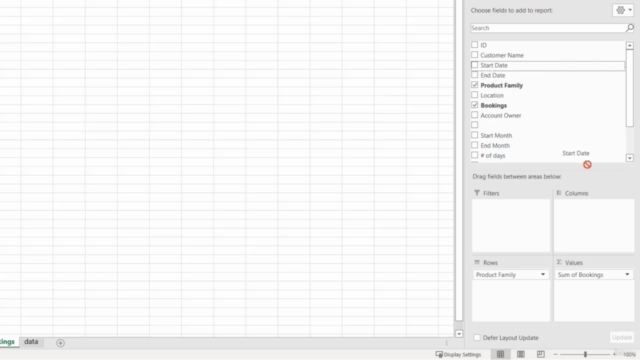
Create pivot tables
Build summary tables
Analyze metrics trends
Create effective graphs
Format charts for quality presentations
Simple forecasting
SaaS / Software Company Analysis
Bookings, ARR, Customer Analysis
Screenshots


Related Topics
4688082
udemy ID
5/16/2022
course created date
6/6/2022
course indexed date
Bot
course submited by