Pivot Tables and Dynamic Dashboards in Microsoft Excel
Learn to use PivotTables in Microsoft Excel and create dynamic Dashboards for clear, visual data analysis
4.99 (76 reviews)

1,688
students
3.5 hours
content
Oct 2024
last update
$13.99
regular price
What you will learn
The use of Pivot Tables and their enormous convenience for creating reports and data analysis
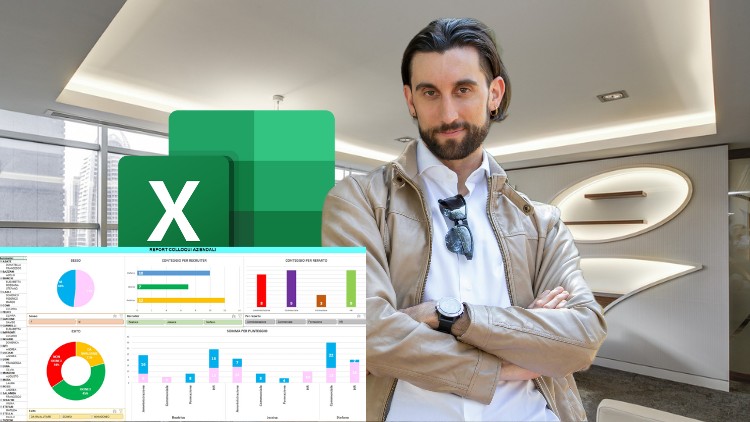
The creation of dynamic Dashboards based on Pivot Tables for a visual and immediate analysis of data through graphs and slicers (data filters)
You will be able to simplify huge amounts of data in an effective and visually clear way using Dynamic Dashboards
With the knowledge of Pivot Tables and Dynamic Dashboards, you will have a phenomenal skill in your CV that will guarantee you a competitive advantage
There will be mentions of Power Query and Macros in Microsoft Excel
Creating dynamic dashboards in Microsoft Excel is a great alternative to the more complicated use of Microsoft Power BI
Screenshots


6163303
udemy ID
9/3/2024
course created date
9/8/2024
course indexed date
Bot
course submited by