Mastering the Seven Essential Quality Improvement Tools
Master the basic 7 QC Tools: Control Charts, Histograms, Scatter Plots, Fishbone Diagrams, and Flowcharts for CPHQ Pre
4.33 (46 reviews)

8,143
students
9 hours
content
Jan 2025
last update
$44.99
regular price
What you will learn
Provides the basic Quality Management knowledge.
Demonstrate a comprehensive understanding of each of the seven basic quality tools: Pareto chart, cause-and-effect diagram (fishbone diagram), check sheet, cont
Discover invaluable tips for selecting the most appropriate quality tools to optimize your processes and outcomes.
Analyze data effectively using the seven basic quality tools to identify trends, patterns, and root causes of problems.
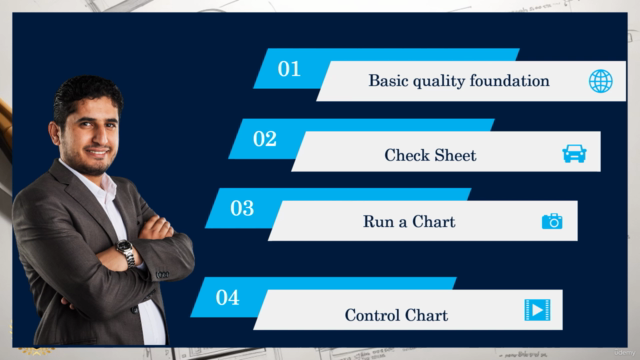
Explore the intricacies of check sheets, including their types, procedures, benefits, and key tips for effective implementation.
Understand the significance of run charts, types of data suitable for them, interpretation rules, and their differences from control charts.
Learn how to leverage Pareto charts, understand the 80/20 rule, conduct Pareto analysis, and overcome limitations.
Delve into histograms, discern when to utilize them, and analyze various distribution shapes for meaningful insights.
Uncover the power of scatter diagrams, comprehend correlation, interpretation, and address common limitations.
Master the application of control charts, calculate control limits, identify patterns, and interpret results using Nelson Rules.
Learn the art of flowchart creation, understand their significance, levels, symbols, and various types.
Explore the application of stratification in quality control, its benefits, and potential pitfalls.
Master the fishbone diagram technique, understand its applications, key concepts, and procedural steps for effective problem-solving.
Screenshots

5331730
udemy ID
5/17/2023
course created date
2/20/2024
course indexed date
Bot
course submited by