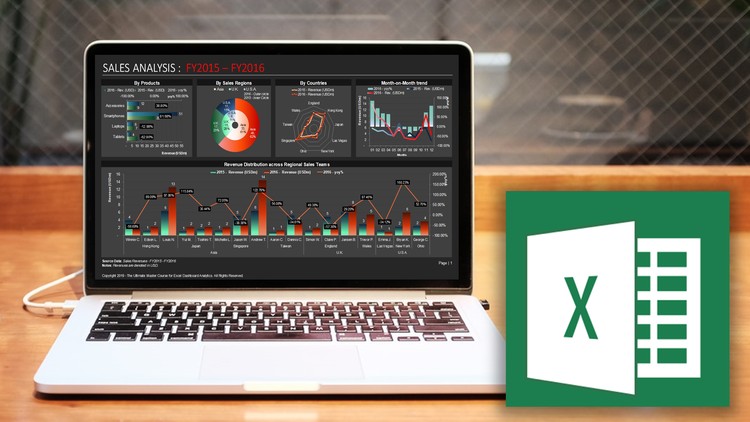
Ultimate Master Course for Excel Dashboard Analytics
Learn Data Analytics, build interactive Dashboards and Automate your data reports in just 6 hours!
4.11 (100 reviews)

5,936
students
5.5 hours
content
Feb 2020
last update
$39.99
regular price
What you will learn
Learn quick-and-effective data-handling techniques to produce high-impact analysis on data drawn from multiple different sources
Learn advanced formatting and charting techniques to create powerful data visualizations for effective data analysis
Learn how to build impressive and professional-looking dashboards that are dynamic and interactive from scratch
Learn how to use VBA Macros to create automated Dashboards and Data Reports for efficient analysis
Microsoft Excel, Excel Dashboards, Pivot Tables, Pivot Charts, Excel Formulas
Data Analysis, Excel Formulas, Data Spreadsheets, Data Tables, Data Charts, Databases
Big Data, Data Analytics, Data Visualization, Data Science
Related Topics
2699082
udemy ID
12/10/2019
course created date
1/30/2020
course indexed date
Bot
course submited by