Visualization and Imputation of Missing Data
Learn to create numerous unique visualizations to better understand patterns of missing data in your data sample.
3.62 (37 reviews)

1,311
students
5 hours
content
Sep 2020
last update
$29.99
regular price
What you will learn
Use visualizations created by R software to identify patterns of 'missingness' in data sets and to impute reasonable values to replace the missing data.
Recognize and identify the different patterns of missing data and the relative severity of their likely consequences.
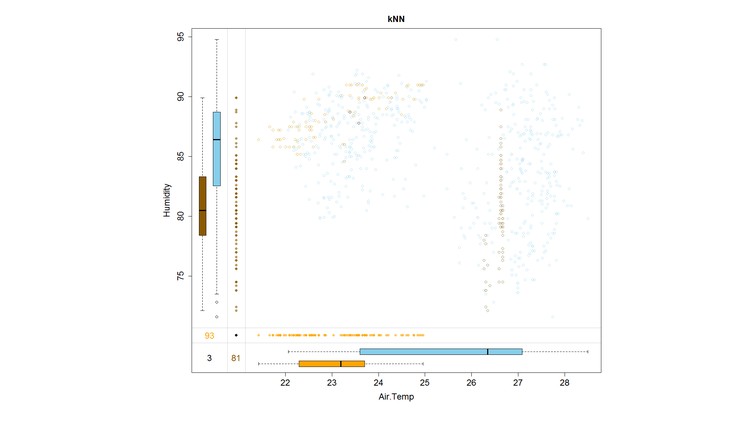
Learn to use the VIM and VIMGUI R packages to create unique, novel and vibrant images which promote the understanding of patterns of both missing and imputed data in a set of data.
Learn the different historical approaches to impute reasonable values for missing data and their relative advantages and disadvantages.
Learn the characteristics of: (1) Hot-Deck; (2) K-Nearest Neighbor; (3) Regression-Based; and (4) Iterative, Model-Based, Stepwise Regression (IRMI) imputation techniques to "fill in" missing data and when and how to implement them with provided software.
Screenshots


Related Topics
631264
udemy ID
10/5/2015
course created date
11/22/2019
course indexed date
Bot
course submited by